FAIRDO BG example 3.9.cellml
Bond graph example: Nernst-Planck and ion channel gating
The figure below shows the bond graph representation of the diffusive solute flux through the membrane and the flux of electrical charge (qem) from its capacitive storage in the membrane, with the biochemical equivalent of the membrane potential uem (J.C − 1) being zqFuem (J.mol − 1), where F (C.mol − 1) is the Faraday constant and zq is the valence (zq = 1 for Na + , zq = 2 for Ca2 + ). Units have been added to the variables to clarify the transport of moles versus Coulombs and the chemical potentials (J.mol − 1) versus the electrical potential (J.C − 1). Note that the transforming factor zqF ensures that the product of electrical current flow zqFvim (C.s − 1) and electrical potential uem (J.C − 1) equals the product of chemical flow vim (mol.s − 1) and chemical potential zqFuem (J.mol − 1).
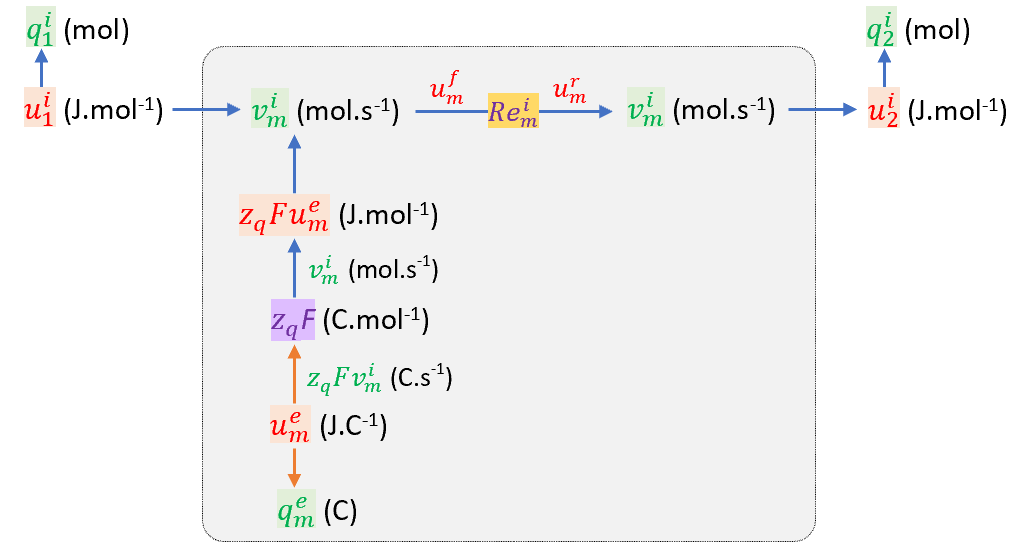
The bond graph representation of the diffusive flow vim of electrically charged ions through a channel in a membrane across which there is a potential difference uem. The colour of the power flux arrows is blue for mole transfer and brown for charge transfer. Note on subscripts: ‘1’=cytosol, ‘2’=extracellular, ‘m’=membrane.
The Views Available menu to the right provides various options to explore this model here in the Physiome Model Repository. Of particular interest is the Launch with OpenCOR menu item, which will load the simulation experiment shown below directly into the OpenCOR desktop application.
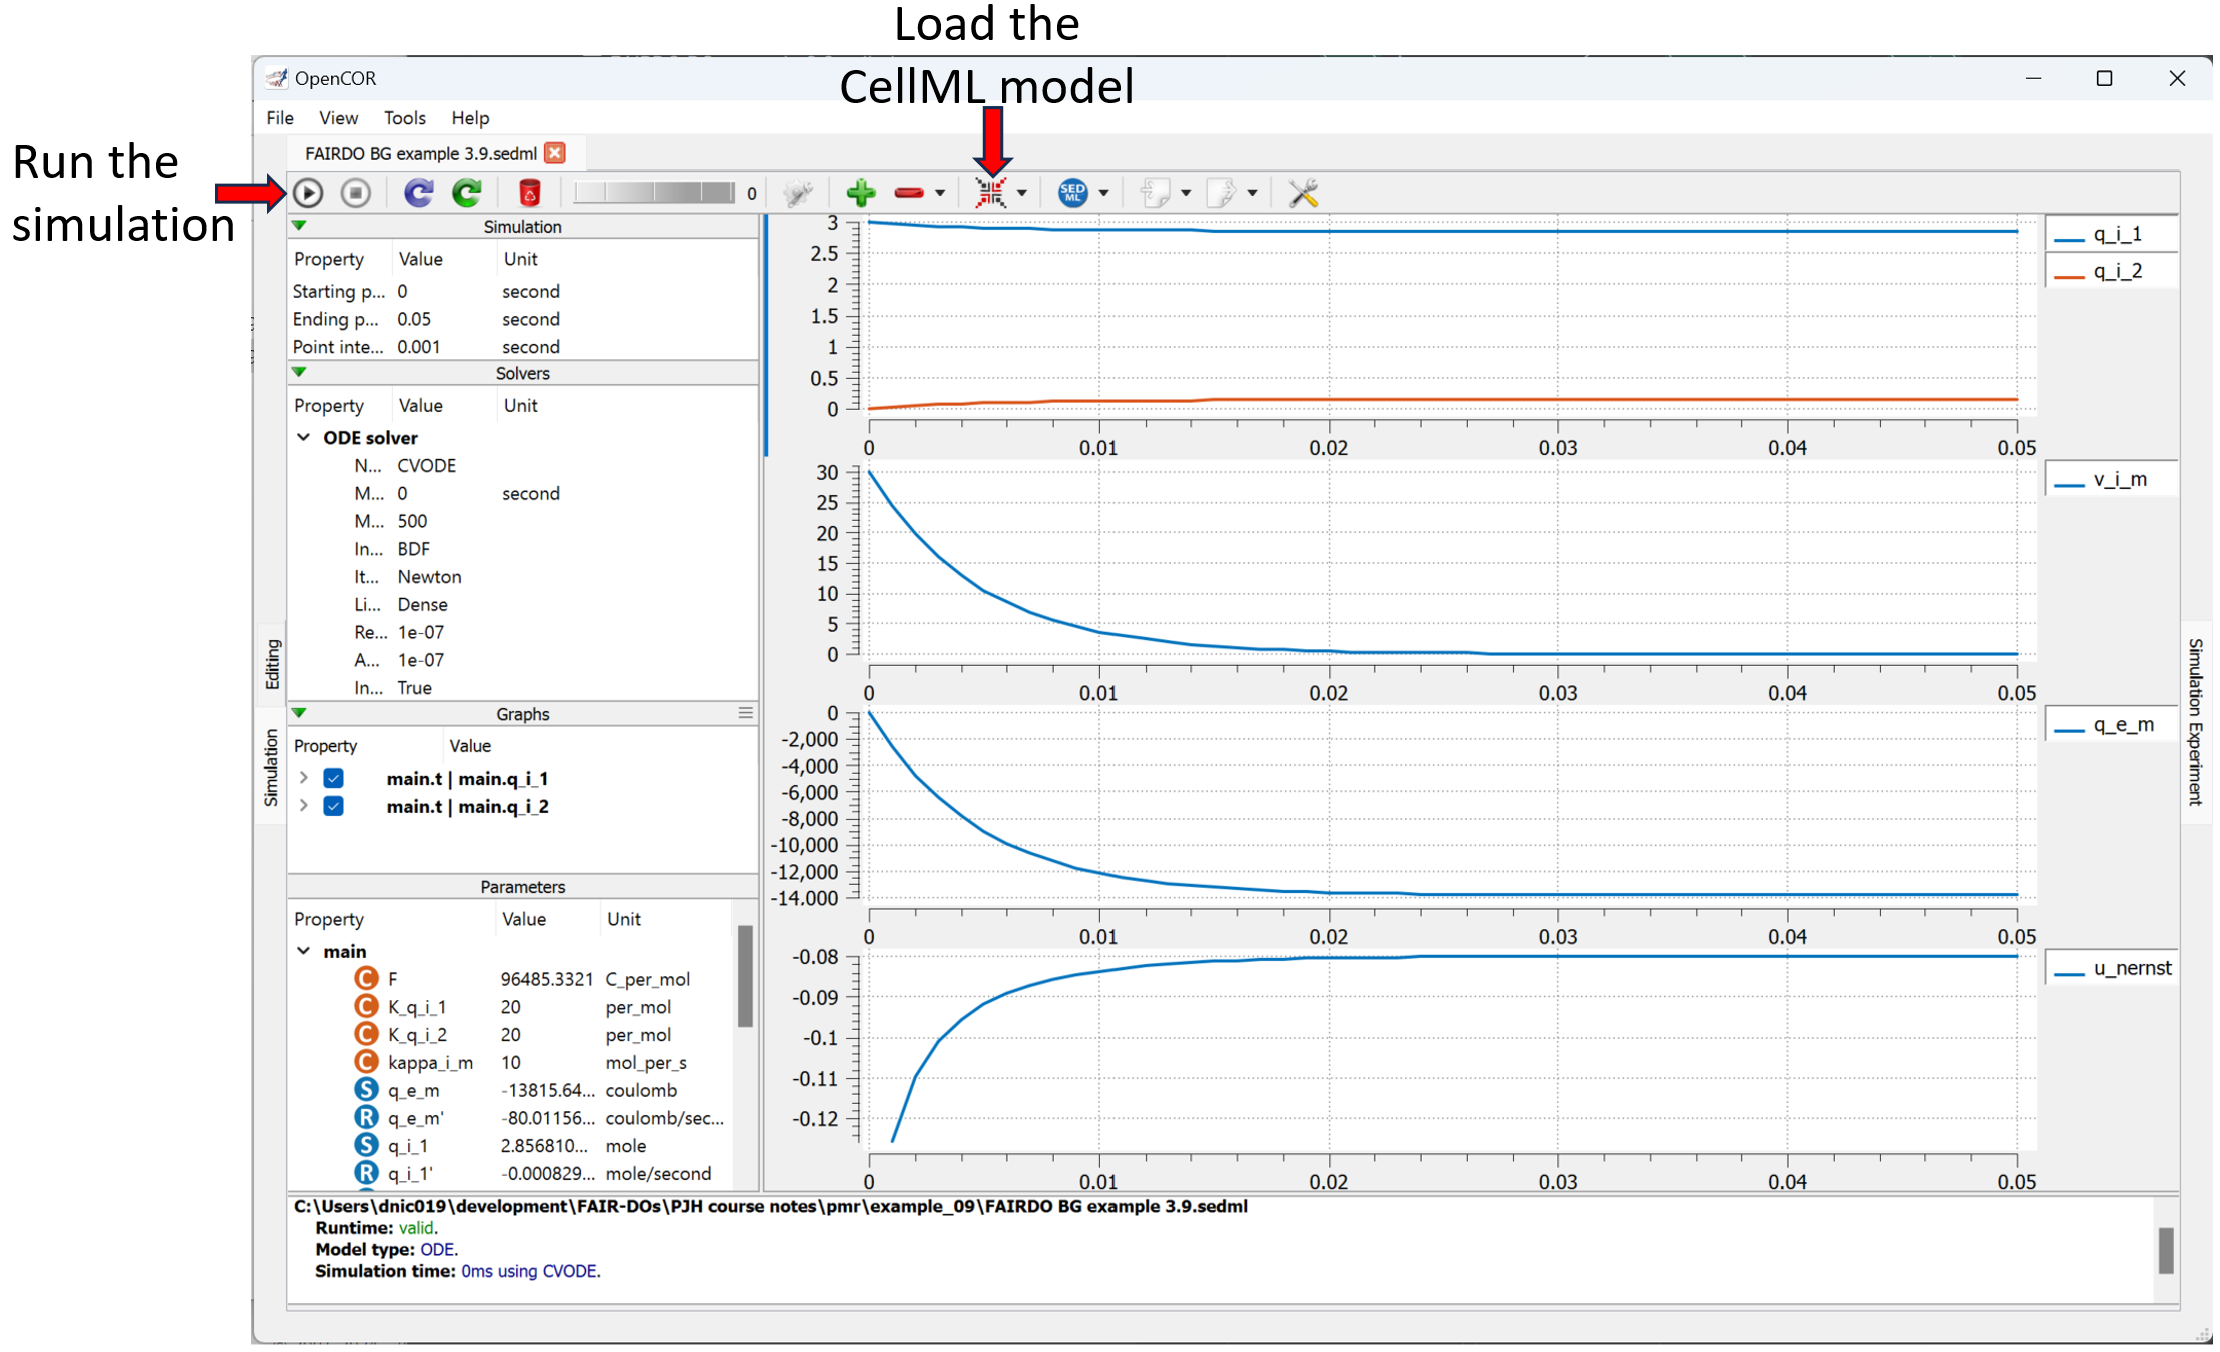
Showing the result of launching the simulation experiment from this exposure in OpenCOR and executing the simulation.