AE1-BG
About this model
| Original publication: | |
|---|---|
| Weinstein, A. M. (2000): "A computational model of induced pluripotent stem-cell derived cardiomyocytes incorporating experimental variability from multiple data sources" J Physiol. 2019 Sep 1; 597(17): 4533-4564. | |
| DOI: | https://doi.org/10.1152/ajprenal.2000.279.1.F24 |
Figure 03
Chloride and Biocarbonate Flux through AE1 exchanger
The solute-carrier (SLC) group of membrane transport proteinscarry nutrients and metabolites across cell membranes. They areassociated with 400 genes that code for 65 protein familiesAE1 is the member of solute carrier family 4 (SLC4A1). This protein known asanion exchanger 1 (AE1) which is a chloride/bicarbonate exchanger(Cl − /HCO3 − exchanger) with a main function of retaining the pH in the correct value. Figure 3 shows the bond graph representation of AE1 exchangermodel and the calculation of Ca − and HCO3 − fluxes across the membrane. There are 6 states for the transportenzyme and 6 reactions for the transitions between these states,where there are all coded up in AE1-BG.cellml file. Each panel of Figure 3 explains the variation of a single internal (A and B) or external (C and D) anion concentration.
AE1-BG.cellml, Weinstein_2000_AE1.cellml and Weinstein_2000_AE1_Fig3.cellml are the the main Cellml files for bond graph model and classic model. inverse03.py is a python script that creat all the bond graph kinetic rates. Fig3A.py, Fig3B.py, Fig3C.py and Fig3D.py are the main python scripts which load the SEDML filefor Bg-mdodel and classic model and then plot the fluxes of Cl − through the membrane for both of the files under the conditions that stated in the original paper.
In order to reproduce Figure 3, execute the following script from the command line: cd [PathToThisFile] [PathToOpenCOR]/pythonshell Figure3A-new.py
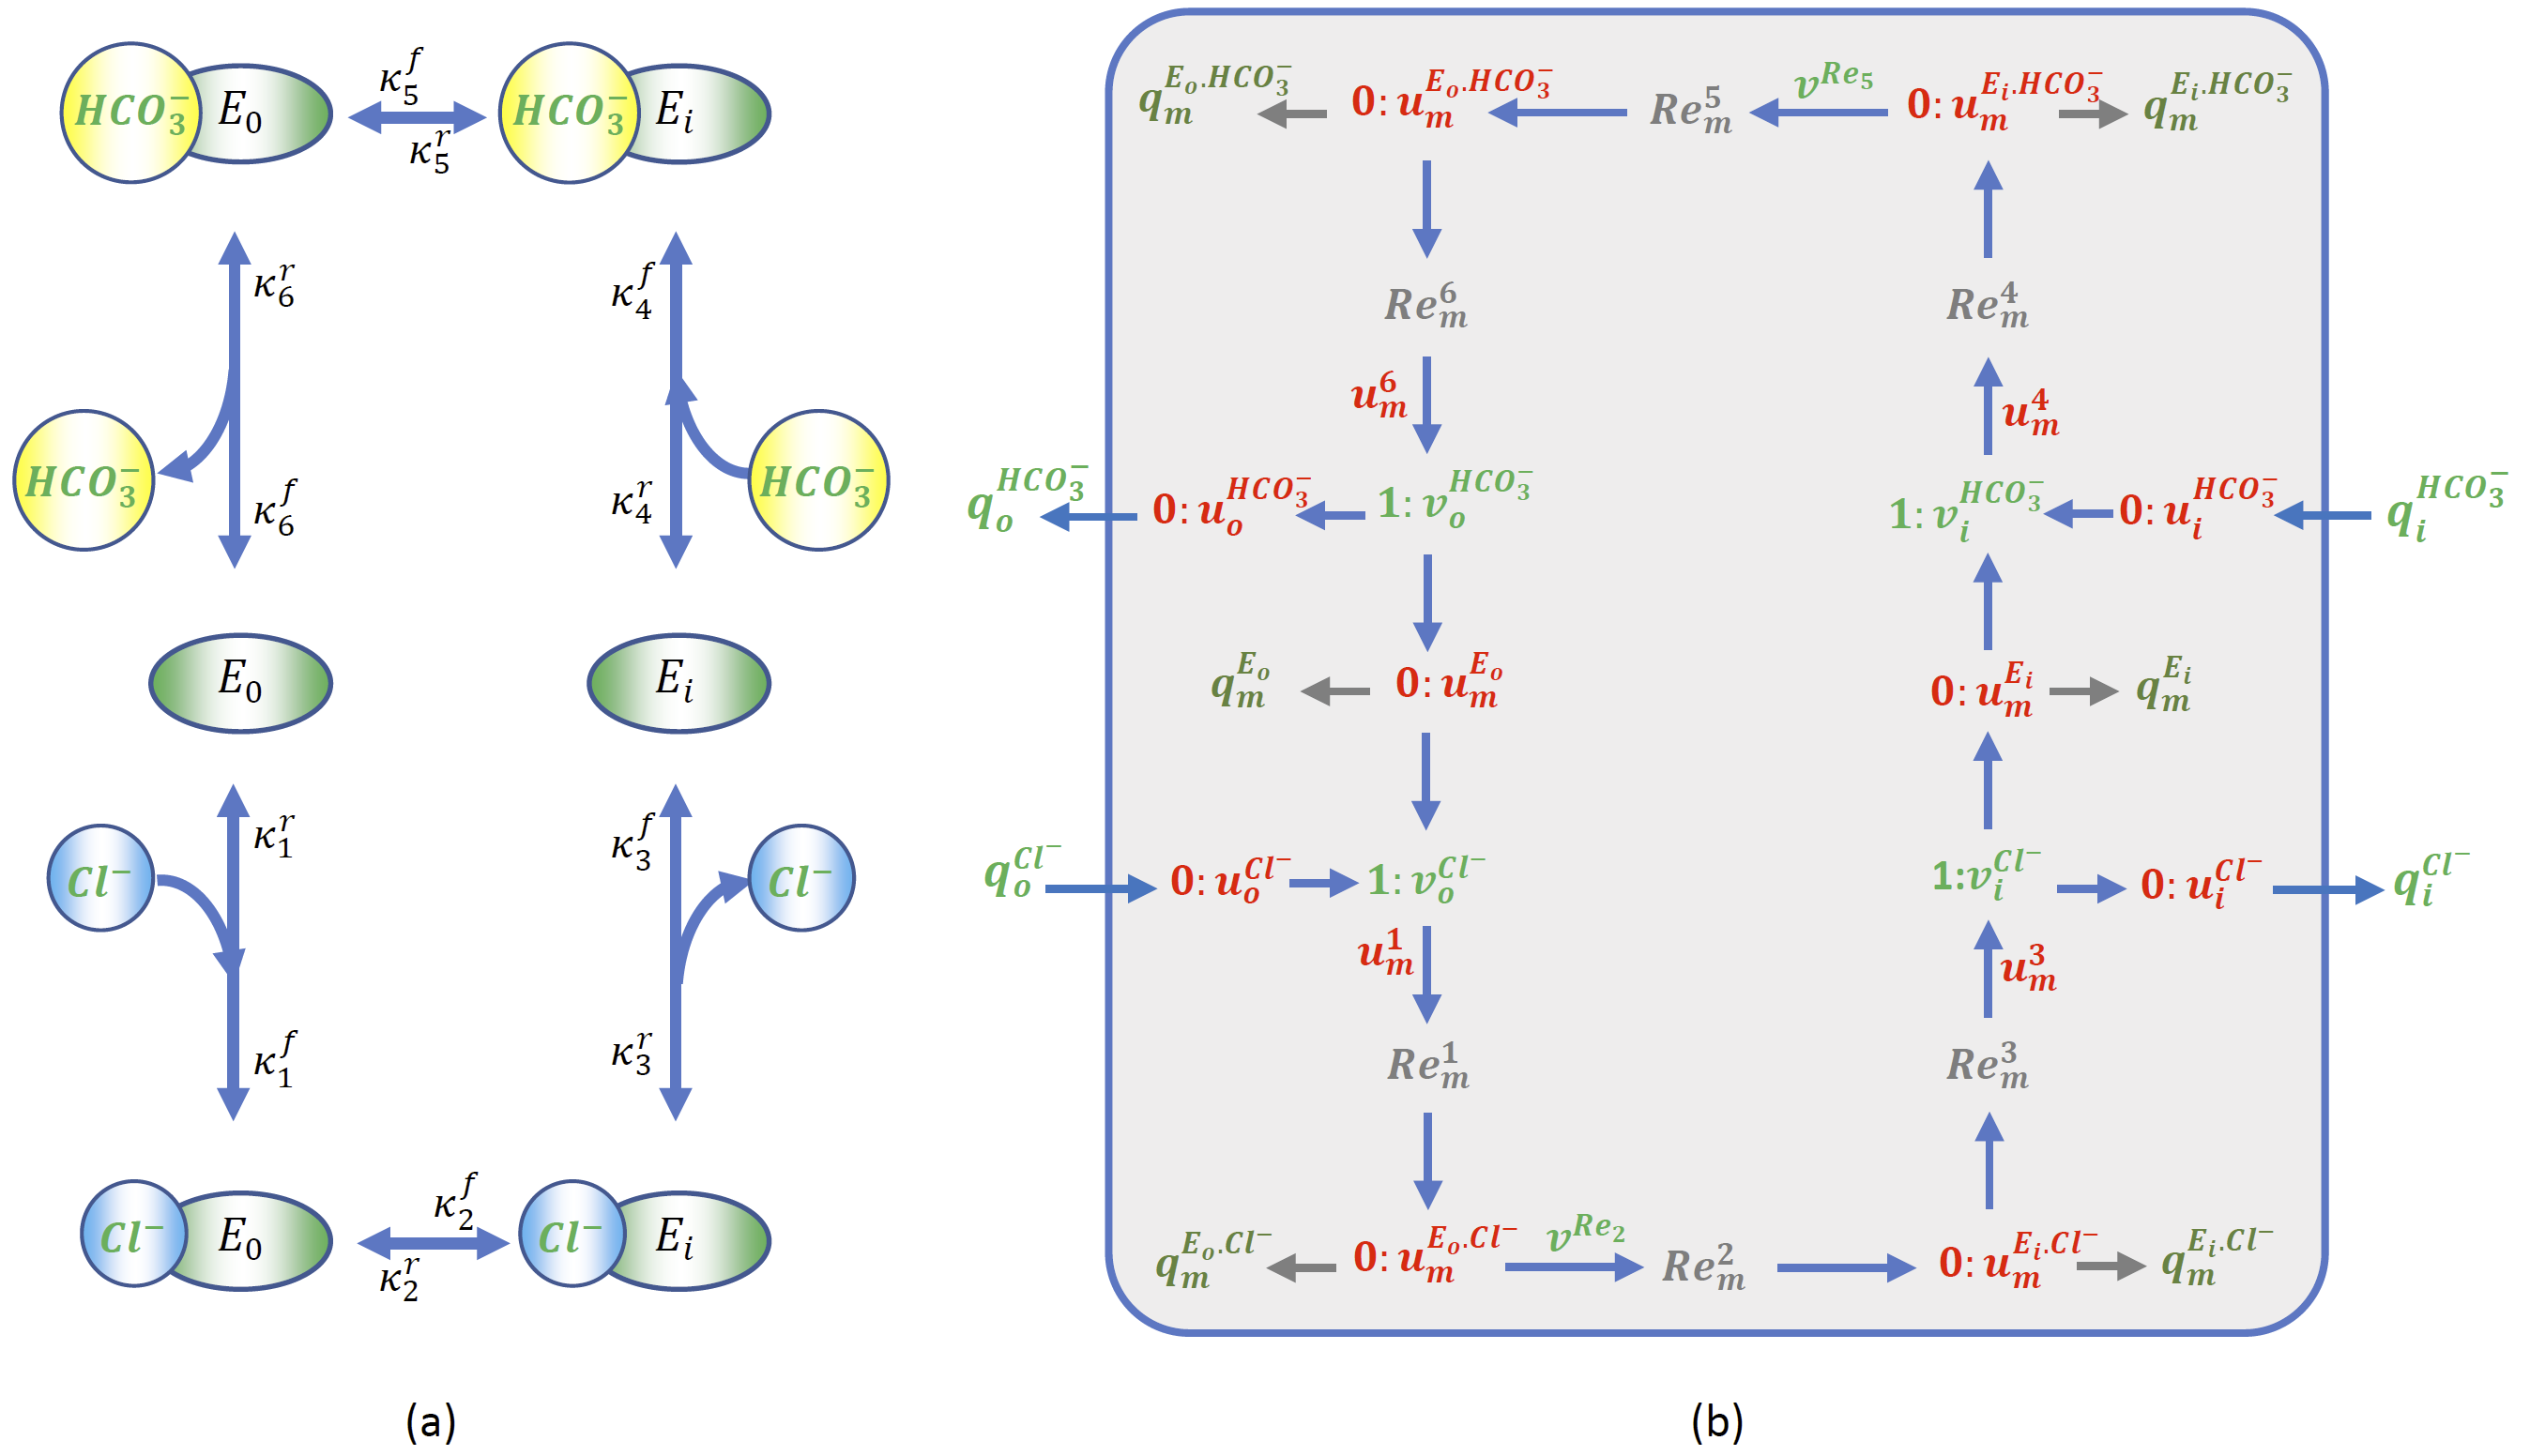
- Schematic diagram of AE1 model. (b) Bond graph representation of AE1 model.